Slovenia in figures
At the mention of statistics, we tend to think of nothing but dull numbers that can only be understood by statisticians and mean nothing to ordinary people, but that is certainly not true. It is especially untrue when data is compared over the span of several years – even more so if we look at a 25-year period. Often such comparisons reveal the true picture, a certain trend of change, while sometimes they prompt us to want to change or improve something.
It is also the case, when looking at numbers, that some remain the same, while others change constantly. In geographical terms, we cannot expect the number of square kilometres occupied by Slovenia to increase, so this is the first number that has remained unchanged in 25 years. Thus, after all these years, Slovenia still has the surface area of 20,273 km2, we still have 46.6 kilometres of coastline, 1,370 kilometres of state borders, and we still cannot climb higher than 2,864, which is the altitude of Triglav.
As a proverbially green country, on the other hand, we can be delighted by the fact that there has been a slight increase in forest cover. In 1993, 56.5% of Slovenia was covered by forest, while in 2014, forest covered 58.3% of our country.
Population
The first statistical change that has happened over the past 25 years is the number of newborn babies and the total population of Slovenia. Although the number of newborn babies has declined slightly over the past 25 years (from 21,583 in 1991 to 21,165 in 2014), the total population has increased. While the population of Slovenia was slightly below two million (1,998,912) in 1991, it numbered 2,046,976 on 1 July 2015.
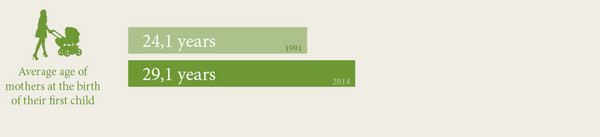
However, there is no getting around the fact that, as is the case elsewhere in Europe, women in Slovenia are deciding to have their first child at an increasingly later age. In 2014, the average age of mothers at the birth of their first child was 29.1, while in 1991, the year in which Slovenia gained its independence, the average was 24.1 years of age.
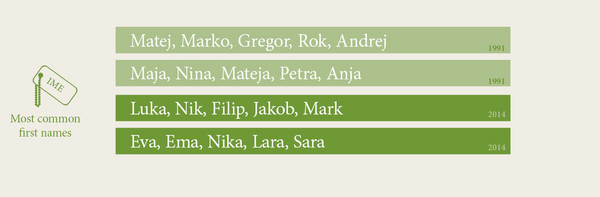
The names given to children at birth are also quite different than they were 25 years ago. In 1991, the most popular baby names were Matej, Marko, Gregor, Rok and Andrej for boys and Maja, Nina, Mateja, Petra and Anja for girls, while in 2014, the most popular names were Luka, Nik, Filip, Jakob and Mark for boys and Eva, Ema, Nika, Lara and Sara for girls.
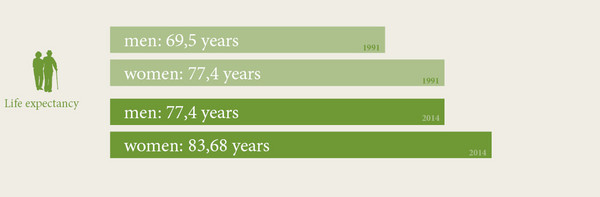
Over the past 25 years, life expectancy has also increased considerably. In 1991, it was 69.5 years for males and 77.4 years for females, while in 2014, it was 77.97 years for males and as high as 83.68 years for females.
In the 1995–2014 period, immigration and emigration to and from Slovenia increased considerably. In 1995, 5,879 people immigrated to Slovenia and 3,372 people emigrated out of the country. In 2014, however, 13,846 people immigrated to Slovenia, while 14,336 people emigrated abroad.
Culture
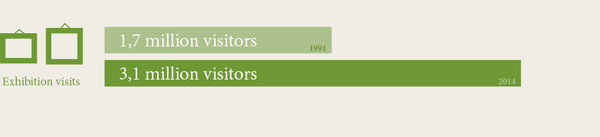
We can be pleased with the statistics in the field of culture. We visit cinemas and exhibitions in museums and galleries in high numbers. In particular, there has been a sharp increase in the number of visits to museum exhibitions. In 1991, 1.7 million people visited exhibitions in museums and galleries, while the number of visitors in 2014 was 3.1 million. On the other hand, the number of visits to cinemas between 1991 and 2014 is more comparable. In 1991, 1.8 million visits were recorded in cinemas, while in 2014, this number was 1.9 million people.
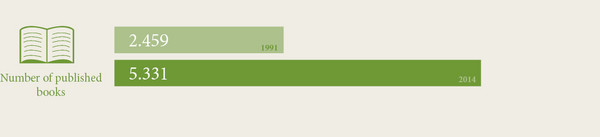
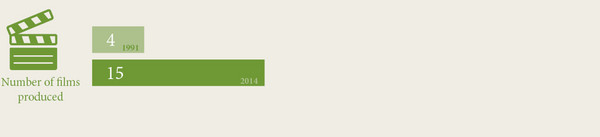
We also write and create more from year to year. Compared to 2.459 books and brochures published in 1991, as many as 5,331 were published in 2014. Among 422 fiction books published in 1991, 249 were original Slovenian literary works (which was 59% of all fiction literature). In 2014, the number of published fiction works was almost six times higher. Although the share of original Slovenian literary works dropped by 9% (to 50%), 713 original Slovenian literary works is a great achievement. Slovenian film production has not been lagging behind either. Compared to 4 full-length films created in 1991, 15 were created in 2014, of which 11 were feature films and 4 were documentaries.
Education
Also encouraging are the statistics on education, for instance the educational structure of population and the number of students enrolled in higher vocational colleges and higher education institutions.
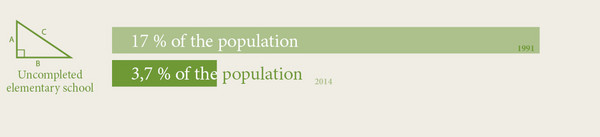
The educational structure of the population is improving, which is a consequence of better access to education in general. In 1991, the primary education level was predominant, while in 2014, the secondary and vocational education levels prevailed. Each year, the number of people with uncompleted elementary school is lower in Slovenia. In 1991, the percentage of people with uncompleted elementary education was 17%, while in 2014, the share was considerably lower, at only 3.7%.
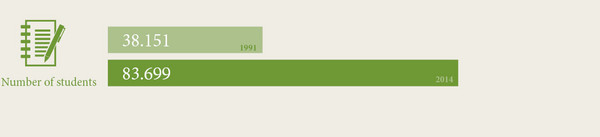
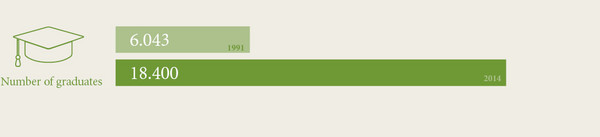
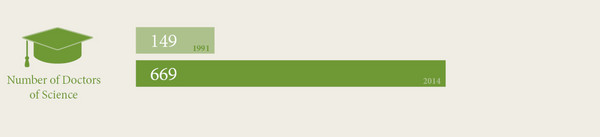
In the 2014/2015 academic year, 83,699 students were enrolled in tertiary education in Slovenia (tertiary education comprises higher vocational, higher undergraduate and higher postgraduate education). 25 years ago, the number was less than half this figure: 38,151. In 1991, 6,043 students graduated at higher education institutions, of which 149 received the title Doctor of Science. In 2014, 18,400 students completed their studies – among them, 669 as Doctors of Science.
Environmental protection
Every inhabitant of Slovenia generated 1.6% more municipal waste (household waste and similar waste from manufacturing and services) in 2014 than in 2002; nevertheless, the recycling rate has been increasing rapidly. In Slovenia, 534,000 tonnes of waste were recycled in 2002, while 2,753,000 tonnes were recycled in 2014.
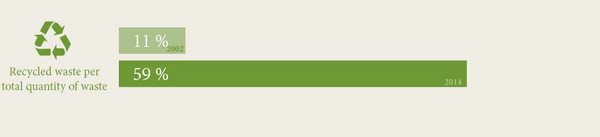
The share of recycled waste in the total volume of generated waste was 11% in 2002 and increased to 59% in 2014.
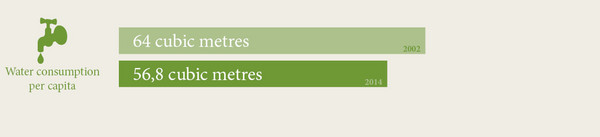
We also became more economical in the use of water. In 2002, per capita water usage was 64 cubic metres, while in 2014 it was 56.8 cubic metres. This means that water usage per capita decreased by 11.3% in the 2002–2014 period.
Economic indicators
Over the past 25 years, economic indicators had been favourable until the emergence of the economic and financial crisis. The GDP stood at EUR 10,521.7 million in 1995 but, by 2014, had risen to EUR 37,303.2 million.
Recently, the trend of registered unemployed persons has deteriorated slightly. In the period 1991-2014, the number of registered unemployed persons increased from 75,079 to 120,109.
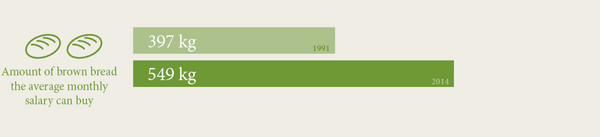
The average monthly salary in 1991 was enough for 397 kilograms of whole-wheat bread, while 549 kilograms could be bought with the average salary in 2014.
Mobile telephony and internet
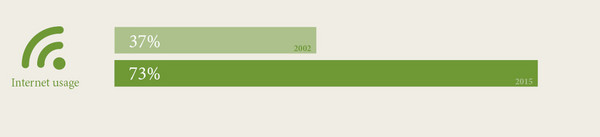
Today, almost three quarters of people aged 16 to 74 use the Internet (73% in the first quarter of 2015). A little over a decade ago, it was used by slightly over a third of people in the same age group (37% in the first quarter of 2014). Today, 77% of regular Internet users read news, papers and magazines via this media and 36% use it for (video) phone calls. In 2004, 44% of regular Internet users read news, papers and magazines over the Internet and 7% used it for (video) phone calls.
Since 2007, the number of mobile network users has increased by 27%, while the number of subscribers has increased by 57%.
Infrastructure
Motorways in 2014 are considerably longer than in 1991. In 1991, we had 193 kilometres of motorways, while the total length of motorways in 2014 was 677 kilometres.
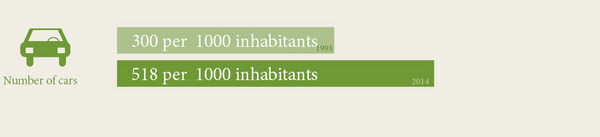
t the end of 2014, there were more than a million (1,016.291) cars in Slovenia, which was more than twice as many as in 1992 (575,675). This means that in 2014, we owned more than one car per two inhabitants (518 cars per 1000 inhabitants), while in 1991 there was one car for every third inhabitant (approximately 300 cars per 1000 inhabitants). However, the average age of cars has been increasing over the recent decade. In 2001, the average age of a car was 6.4 years, while in 2014, the average age of a car was 9.4 years.
data source: Statistical Office of the Republic of Slovenia